Making Web3 dashboards easier to navigate.
Mobile and desktop dashboard design for collectors and creators.
Explore the work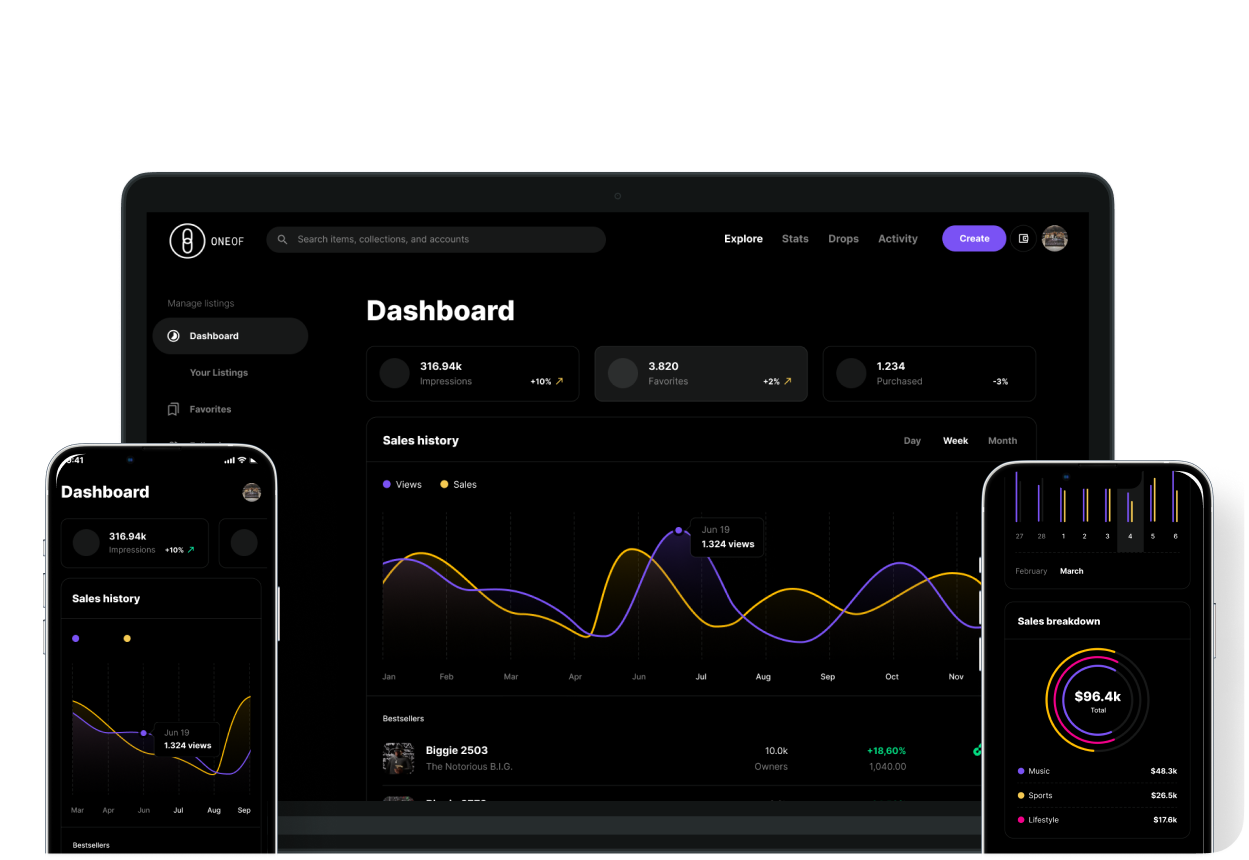
- Client
- OneOf
- My role
- Research lead · UX & UI design
- Timeline
- 2 months
- Tools
- Figma, FigJam, Miro
- Delivery status
- Shipped product
Design exploration → Tested prototype → Shipped product
A dashboard experience for people collecting and creating digital assets. My work brought collections, activity, payouts, and NFT creation together across desktop and mobile.
01 / THE WORKSPACE
One workspace. The details that matter.
Explore the dashboard directions, collection listings, and payout states. Each view makes a different part of managing digital assets visible.
02 / THE CREATION JOURNEY
A complex task, one decision at a time.
A seven-screen flow for creating a digital collectible (NFT), from blockchain selection to a final publishing review. Choose a step to see the design.
MOBILE VISUALS
The same product, made for a smaller screen.
Swipe through dashboard and selection screens. The mobile work keeps the focus on one task at a time.
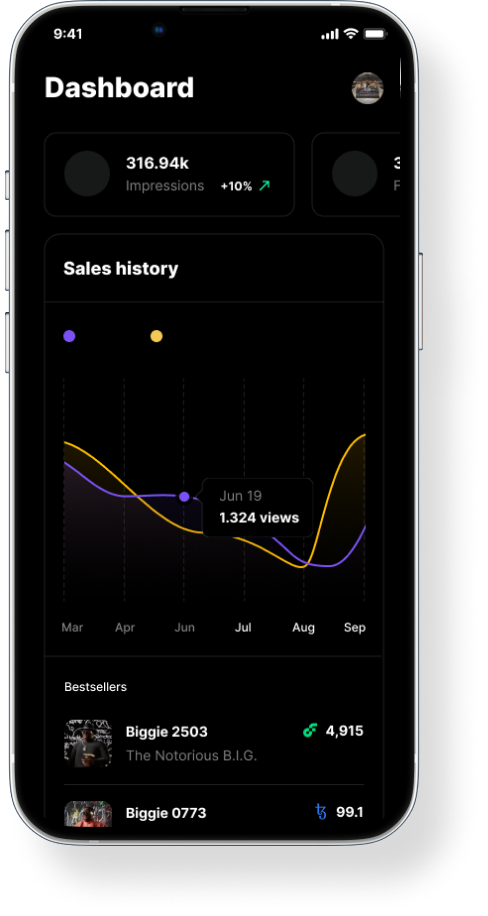
Dashboard overview
A mobile view of the dashboard and its key product information.
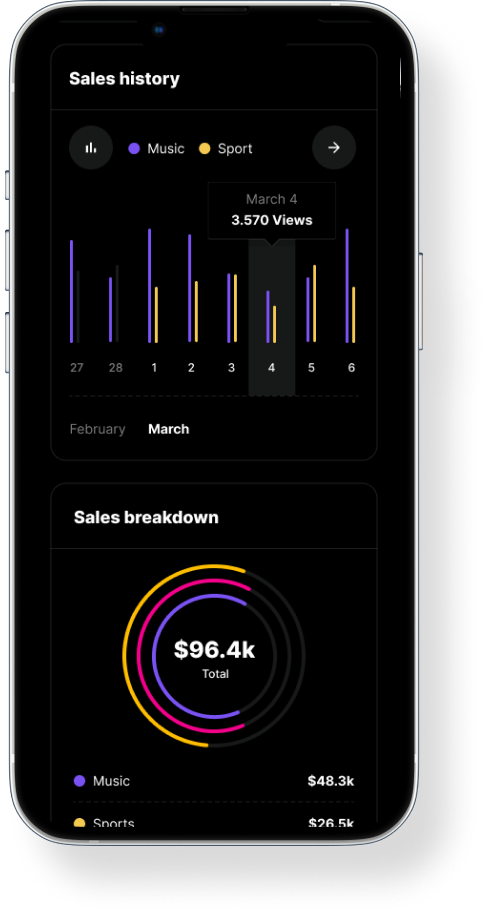
Dashboard alternative
An alternate mobile dashboard direction.
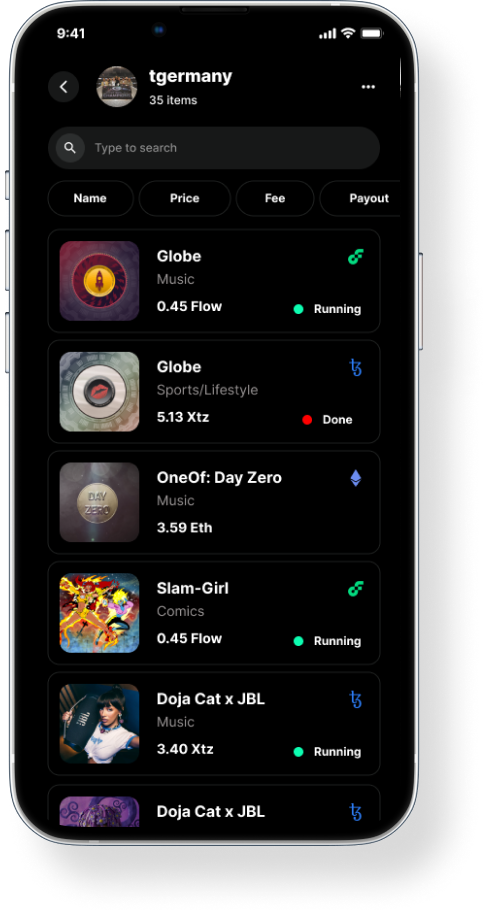
Choose a collection
A focused collection-selection screen for the mobile workflow.
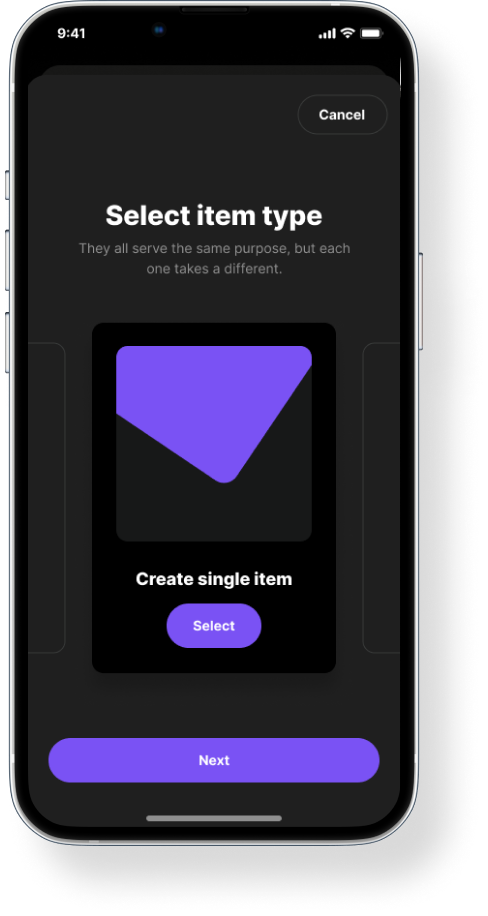
Select an item
Item selection presented as a dedicated mobile task.
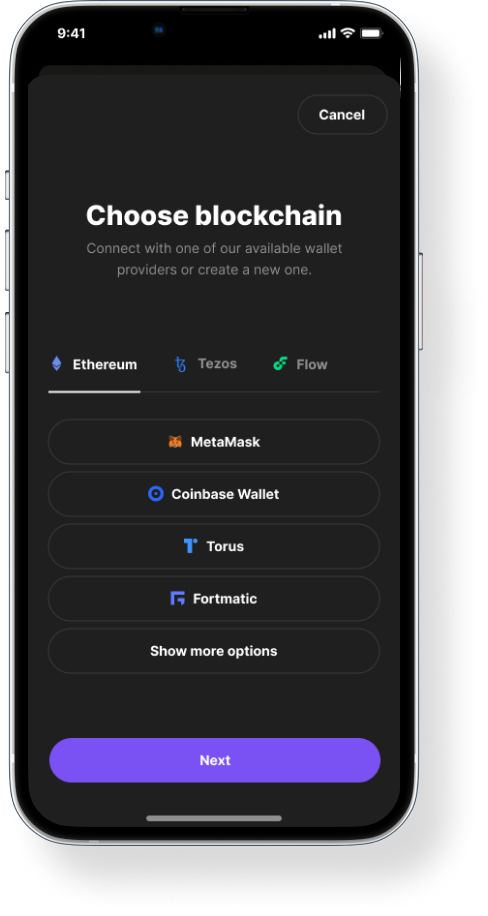
Choose a blockchain
Blockchain selection adapted to a narrow screen.
03 / RESEARCH, UX & UI DESIGN
Turning complexity into clear product decisions.
My responsibility
I led research, UX and UI design across desktop and mobile—from product structure and flows to prototyping and testing.
Key design takeaway
My design takeaway: managing digital assets and creating a collectible need different experiences. One calls for an overview; the other, a focused sequence of decisions.
What I delivered
I designed connected activity, collection and payout views, a guided NFT creation flow, and mobile screens.
Design scope
- creation screens
- 7
- desktop views
- 5
- mobile views
- 5
Design decisions & supporting screens
Explore a decision to see the thinking and the designs behind it.
Separate managing assets from creating them2 supporting screens
I gave ongoing activity and asset information a dashboard view, while creation starts in a dedicated flow. These screens show how I separated monitoring from making a new collectible.
Supporting designs appear in the workspace and creation galleries above.
Clarity before commitment2 supporting screens
I organized NFT creation into focused decisions and separated item details from the final publishing review. My intent was to give creators a clear sequence and a checkpoint to review their collectible before publishing.
Supporting designs appear in the workspace and creation galleries above.
Design the payout experience before data exists2 supporting screens
I included both a payout view and an empty state, so the interface also accounts for an account with no payout activity to display.
Supporting designs appear in the workspace and creation galleries above.
Research & design approach
From product structure to interface detail.
My work spanned research, product visualization, prototyping, and testing over a two-month project. These artifacts show how the experience was mapped and explored.
Map the experience
Use personas, sitemaps, and process maps to organize the dashboard experience before refining the screens.
Explore across devices
Develop low- and high-fidelity directions for dashboards, collections, payouts, and creation on desktop and mobile.
Connect the journey
Bring the screen designs into interactive prototyping and testing as part of the product design process.
Early visual directions
Additional mobile and desktop explorations show how the visual language carried across screen sizes.
Mobile direction 01
An early mobile presentation of the dashboard experience.
Mobile direction 02
An alternate mobile direction within the same product family.
Desktop direction
A desktop overview bringing the dashboard into its device context.
Product maps & early structure
The original process maps capture the structure behind the dashboard and creation workflows.
Product structure
An overview of the product structure and the connections between its key areas.
Workflow detail
A closer look at the mapped product flows that informed the interface explorations.