
AI Trading. Human Control.
A design concept for AI-assisted trading. Figures in the interactive prototype are illustrative; it does not execute trades.
My role Principal Product Designer
MY CONTRIBUTION
Making proposed automation inspectable.
I led product and UX direction, mapped account access and recovery, and designed the portfolio, trading, bot-setup, and monitoring screens. I built the interactive prototype and supporting FigJam flows and data model. Live exchange connections, model inference, and trade execution are not established by these artifacts.
PRODUCT EXPERIENCE
From insight to action.
Explore the product screens. Select a view to inspect the original design at a useful size.
Portfolio dashboard
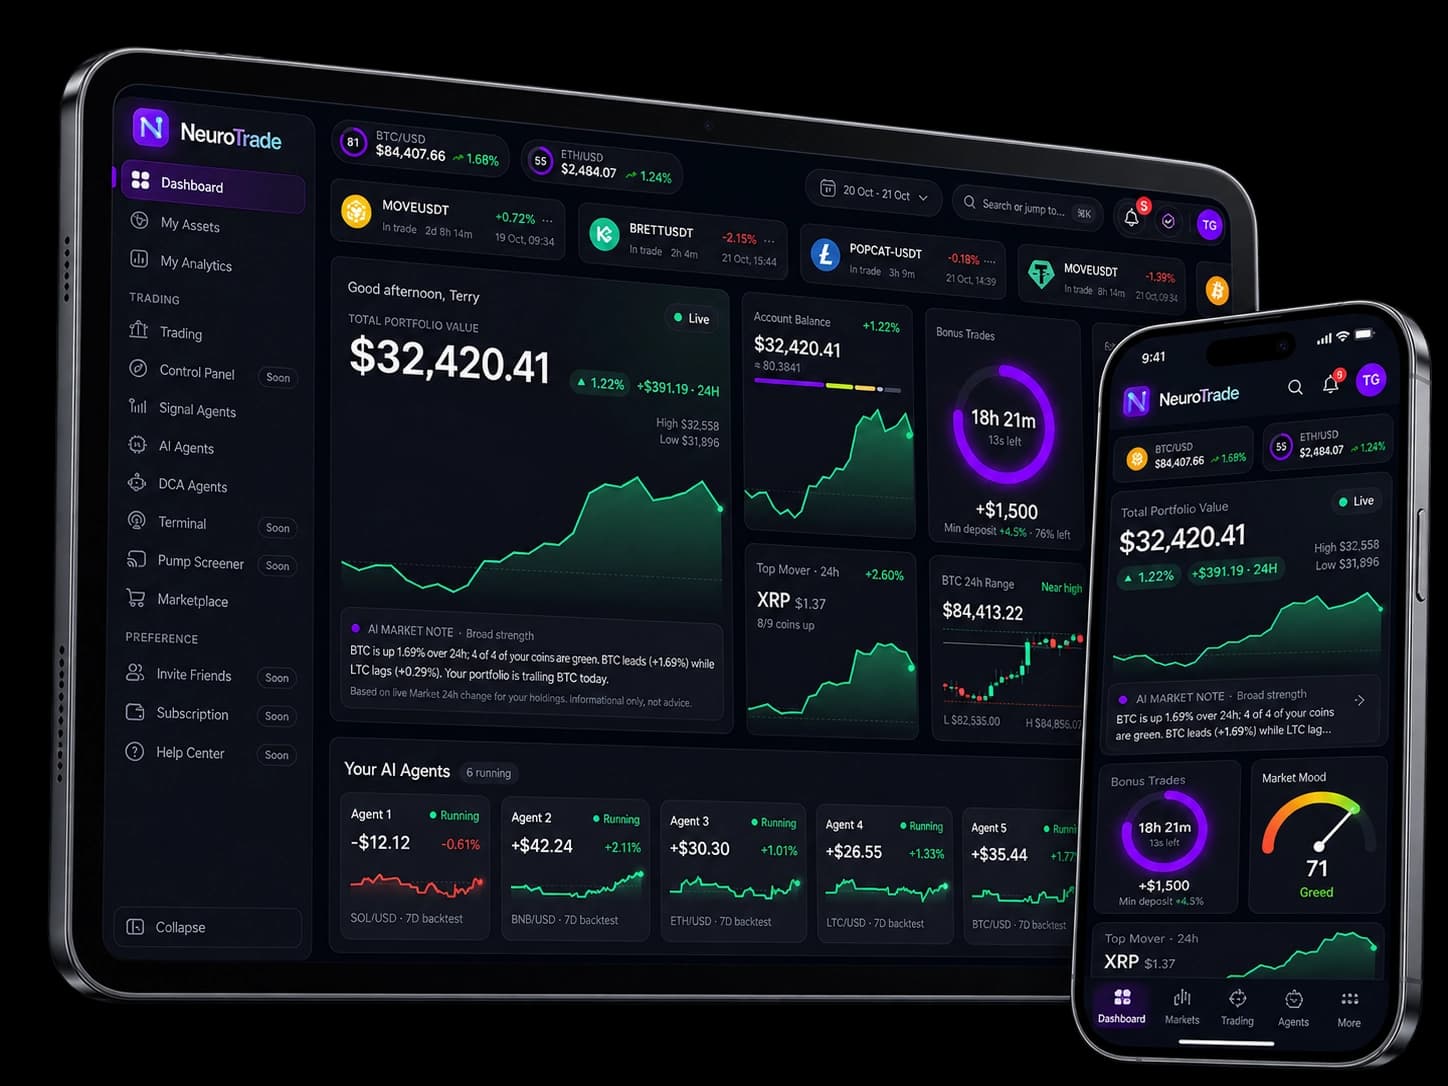
The landing dashboard combines balances, asset holdings, market context, and agent activity so people can orient before choosing a next action.
Figures shown are sample interface data, not verified investment results.
AI WORKFLOW
Automation should be understandable at every step.
I designed the bot flow as a four-step sequence: connect, configure, activate, and monitor. The screens represent proposed automation behavior in a prototype, not a live trading system.
Connect
Select an exchange and establish the account connection before bot setup. The flow makes account access a distinct prerequisite.
THE CHALLENGE
Complex trading. Clearer decisions.
Trading products ask people to interpret dense market information, understand automated strategies, and stay in control while making consequential choices.
- Make portfolio context easier to read.
- Make automated strategy choices visible.
- Keep control clear before and after setup.
KEY DESIGN DECISIONS
Making complex automation understandable.
Three design choices connect the challenge to the interface: orient first, expose setup decisions, and keep configured automation inspectable.
SUPPORTING ARTIFACTS
The structure behind the screens.
The project record documents MVP requirements review, competitor analysis, trader interviews, surveys, and personas. Original FigJam flows and a data model show how discovery informed account access, verification, recovery, and the product structure.
Original design artifacts · Figures inside the screens are sample interface data, not verified investment returns or project outcome metrics.
Account access & recovery
Original FigJam flow showing PIN and password sign-in paths, notification checks, and recovery decisions.
Sign-up & verification
Original FigJam flow showing registration, account review, verification, and the route into login.
Data model
A map of NeuroTrade API entities, account relationships, and the operations that connect user, wallet, asset, and trading data.
VALIDATION & LEARNING
What I would validate next.
These are proposed next steps, not completed usability findings. No prototype-specific validation results, production launch, or financial performance outcomes are documented.
- PROPOSED / 01Setup comprehension
Can a participant explain the selected account, risk setting, and investment before creating a bot?
- PROPOSED / 02Monitoring clarity
Can they identify an active bot, distinguish realized from unrealized performance, and find its edit controls?
- PROPOSED / 03Recovery & control
Can they recover from a connection problem and understand the next available action?
What I delivered
Product UX direction, high-fidelity interfaces, core workflows, an interactive prototype, and supporting artifacts.
A complex financial product earns trust through clear context, inspectable settings, and visible user control.