
01 / CISCO SYSTEMS · ENTERPRISE PRODUCT STRATEGY & UX
Cisco Vision: Scaling enterprise kiosks & digital signage.
Connecting multi-display management, public-facing touch experiences, and enterprise administrative dashboards.
I led UX architecture and dashboard design, bringing complex signage controls into an understandable experience for enterprise and stadium operators.
02 / MY CONTRIBUTION
Connecting complex systems to clear operator workflows.
I connected product strategy, UX architecture, and dashboard design across administrative controls and public-facing screens. My work shaped navigation, multi-screen flows, and reusable interface foundations so operators could move from a venue-wide view to the next task.
I partnered with Product, Engineering, Networking, and Systems Architecture to reconcile user needs with hardware and delivery constraints. Research, workflow exploration, prototypes, and design specifications supported alignment and implementation handoff.
Reusable UI patterns, component states, and layout specifications connected design intent with engineering handoff.
03 / THE ENTERPRISE CHALLENGE
Many screens. One operational picture.
Fragmented controls make it harder to understand what is playing, where it belongs, and what needs attention. The design challenge was to make multi-screen configuration and status legible without overwhelming the operator.
Hardware & touch context
Account for varied aspect ratios, ambient lighting, viewing distance, and public touchscreen targets. A kiosk interaction and an admin action serve different physical contexts.
Data density & telemetry
Prioritize scheduling, display status, and actionable alerts. Reveal detailed device information when needed, while keeping the operational overview scannable.
A consistent component language
Connect administrative portals and public-facing displays through shared hierarchy, states, and layout rules, while adapting interaction patterns to each surface.
04 / SOLUTION & COMPONENT ARCHITECTURE
Connect the control layer to the physical experience.
Organize displays into recognizable groups, keep content assignment close to its destination, and make status visible before the next action. Select a layer to inspect its role.
Venue operations
Venue teams coordinate what needs to happen before, during, and between live events. The interface layer gives operators a place to configure the experience.
Experience-layer view based on Cisco product documentation and the project brief. Original administrative screens and component specifications can be added alongside the available project media.
Structure before detail.
Use a clear display hierarchy, contextual media assignment, and consistent monitoring patterns. Drag-and-drop assignment should retain a visible destination and an accessible alternative.
Consistent across form factors.
Shared layout grids, status indicators, data-visualization widgets, and touch states establish a common language without forcing every display into the same layout.
Reserved for the original browser-frame dashboard showing display hierarchy, content assignment, and status.
Reserved for original touch primitives, layout variants, and component-state documentation.
05 / WORKFLOW, ARTIFACTS & IMPACT
From display discovery to operational confidence.
Four task stages connect the operator’s workspace to the experience on the screen. The snapshot describes the workflow structure; the gallery below shows the available project media.
- 01
Discover the network
Map displays and groups
Venue → Zone → DisplayARTIFACT SLOTTopology wireframe / flow
- 02
Design the kiosk moment
Make touch navigation clear
Entry → Browse → ActionARTIFACT SLOTKiosk UI / touch states
- 03
Orchestrate the content
Connect media to place and time
Content → Assignment → ScheduleARTIFACT SLOTAdmin assignment interface
- 04
Monitor & recover
Surface status and next actions
Status → Alert → ResolutionARTIFACT SLOTDisplay-health dashboard
Fan-facing venue experiences
Digital content wall
Figure 5.1 — A row of large-format screens presents visual content throughout the venue.
Concessions information
Figure 5.2 — Digital menu boards bring event identity and concessions information together.
Interactive display
Figure 5.3 — A large touch display presents a browsable vehicle experience in a public space.
Venue wayfinding
Figure 5.4 — A venue screen surfaces event, location, and visitor information in context.
Fan social wall
Figure 5.5 — A social wall concept brings fan posts and game-night energy onto the venue display.
Game-day weather display
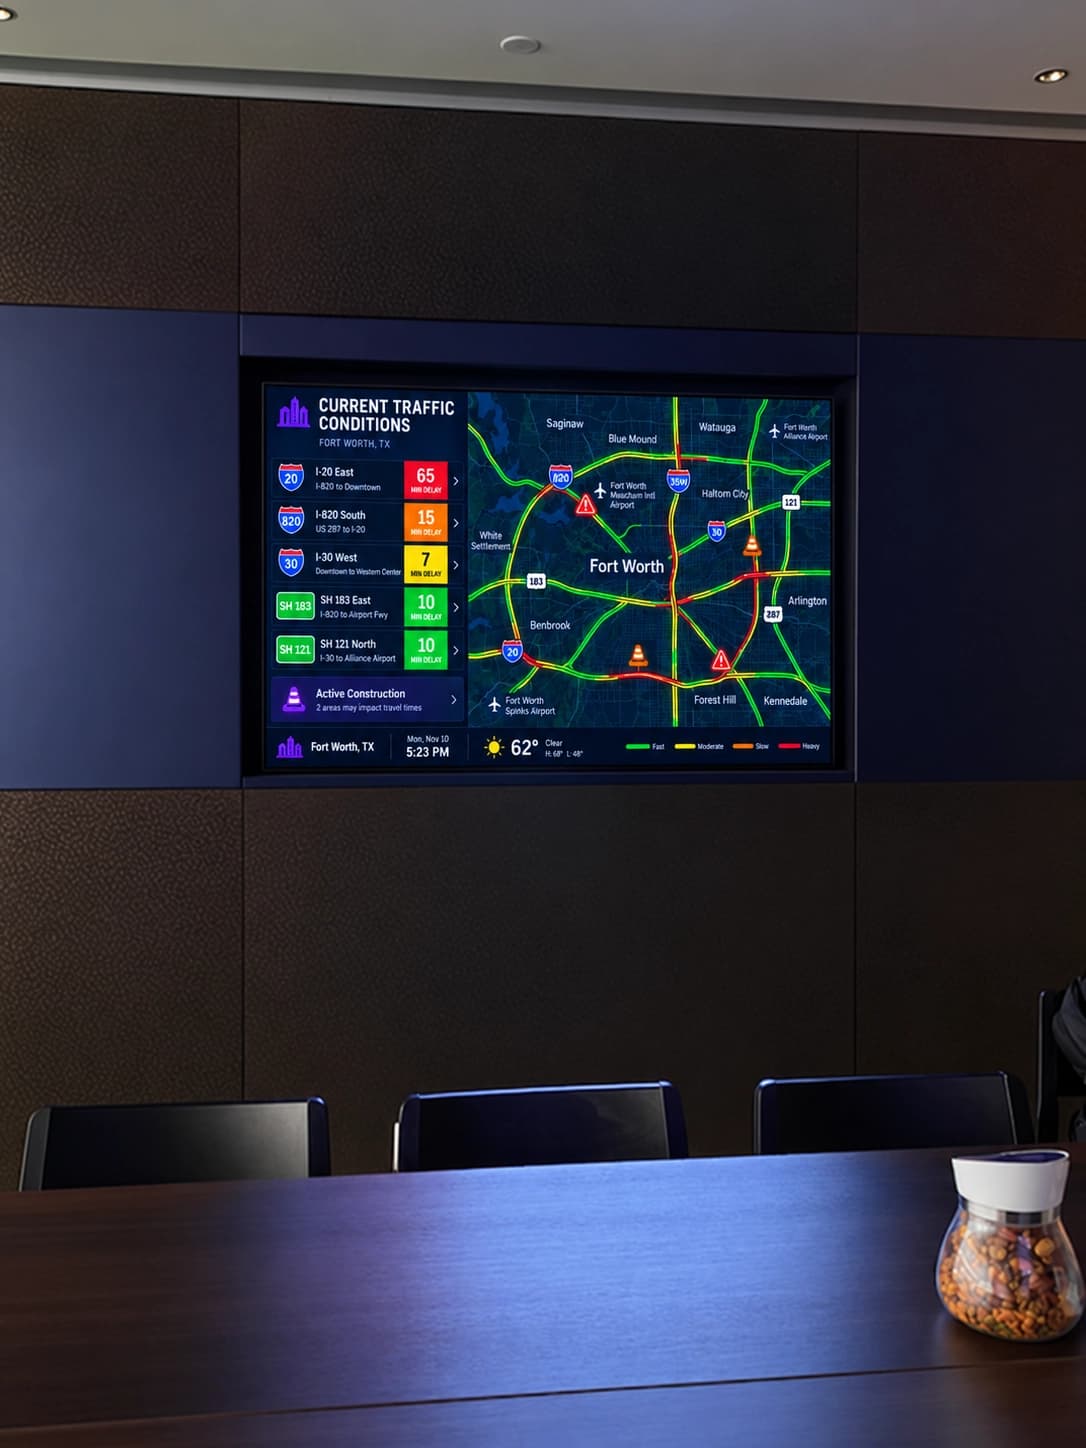
Figure 5.6 — Venue, weather, and event details in one glanceable fan-facing screen concept.
Event matchup display
Figure 5.7 — A bold matchup screen helps set the scene before the game begins.
SPECIAL PROJECT / CDW × WEST COAST CUSTOMS
A connected experience.
Built to travel.
The CDW Technoliner brought interactive displays, collaboration spaces, and Cisco StadiumVision into a mobile technology showcase built by West Coast Customs.
The showcase on wheels
CDW Technoliner outside West Coast Customs.
Inside the experience
Touchscreens and shared spaces for hands-on demonstrations.
Behind the screens
Onboard server racks supporting the technology showcase.
Technology meets the street
The vehicle’s exterior display installation.
The people behind the project
A moment with the West Coast Customs team.
Bringing the showcase together
Project event and team gathering.
Why it belongs in this storyA real-world setting for connected content: the experience extends from the control system to the screen and the space around it.
Read the project story (opens in a new tab)DELIVERABLES & STRATEGIC LESSONS
Clarity at the control layer. Consistency at the screen.
The work connected enterprise workflows, dashboard foundations, and physical display experiences through a reusable interface language.
What the work established
- UX architecture linking operators, content, and display destinations.
- Reusable patterns for navigation, layout, status, and touch interaction.
- Cross-functional design specifications and implementation alignment.
What I would measure
Configuration effort, operator task-completion time, assignment errors, and recovery success. Measured improvements are not yet documented here.